
Page 103 - NIENGIAM
P. 103
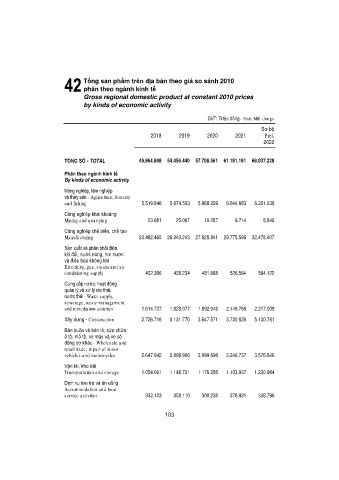
Tổng sản phẩm trên địa bàn theo giá so sánh 2010
                        43
                              phân theo ngành kinh tế
                              Gross regional domestic product at constant 2010 prices
                              by kinds of economic activity

                                                                          ĐVT: Triệu đồng - Unit: Mill. dongs

                                                                                             Sơ bộ
                                                      2019      2020      2021      2022      Prel.
                                                                                              2023


                        TỔNG SỐ - TOTAL           54.456.440  57.708.561  62.559.880  71.112.707  78.262.979
                        Nông nghiệp, lâm nghiệp
                        và thủy sản - Agriculture, forestry
                        and fishing                5.674.503   5.868.229   6.044.345   6.207.432   6.364.480
                        Công nghiệp khai khoáng
                        Mining and quarrying         25.067    10.287     4.805    4.897     4.661

                        Công nghiệp chế biến, chế tạo
                        Manufacturing             26.043.243  27.628.841  31.046.510  34.140.308  36.398.975

                        Sản xuất và phân phối điện,
                        khí đốt, nước nóng, hơi nước
                        và điều hòa không khí
                        Electricity, gas, steam and air
                        conditioning supply         438.234   481.668   516.733   552.760   569.601
                        Cung cấp nước; hoạt động
                        quản lý và xử lý rác thải,
                        nước thải - Water supply,
                        sewerage, waste management
                        and remediation activities   1.828.077   1.892.045   2.080.026   2.059.851   2.111.830
                        Xây dựng - Construction    3.131.770   3.647.571   3.794.282   5.232.017   6.027.357

                        Bán buôn và bán lẻ; sửa chữa
                        ô tô, mô tô, xe máy và xe có
                        động cơ khác - Wholesale and
                        retail trade; repair of motor
                        vehicles and motorcycles   2.898.906   3.099.698   3.334.936   3.747.153   3.883.148
                        Vận tải, kho bãi
                        Transportation and storage   1.148.731   1.176.208   1.145.898   1.305.304   1.356.755
                        Dịch vụ lưu trú và ăn uống
                        Accommodation and food
                        service activities          358.110   300.238   270.632   343.307   388.927
                        Thông tin và truyền thông
                        Information and communication   1.357.917   1.427.826   1.470.707   1.571.545   1.554.687


                                                           103